Climate Research Infographics
Information Design
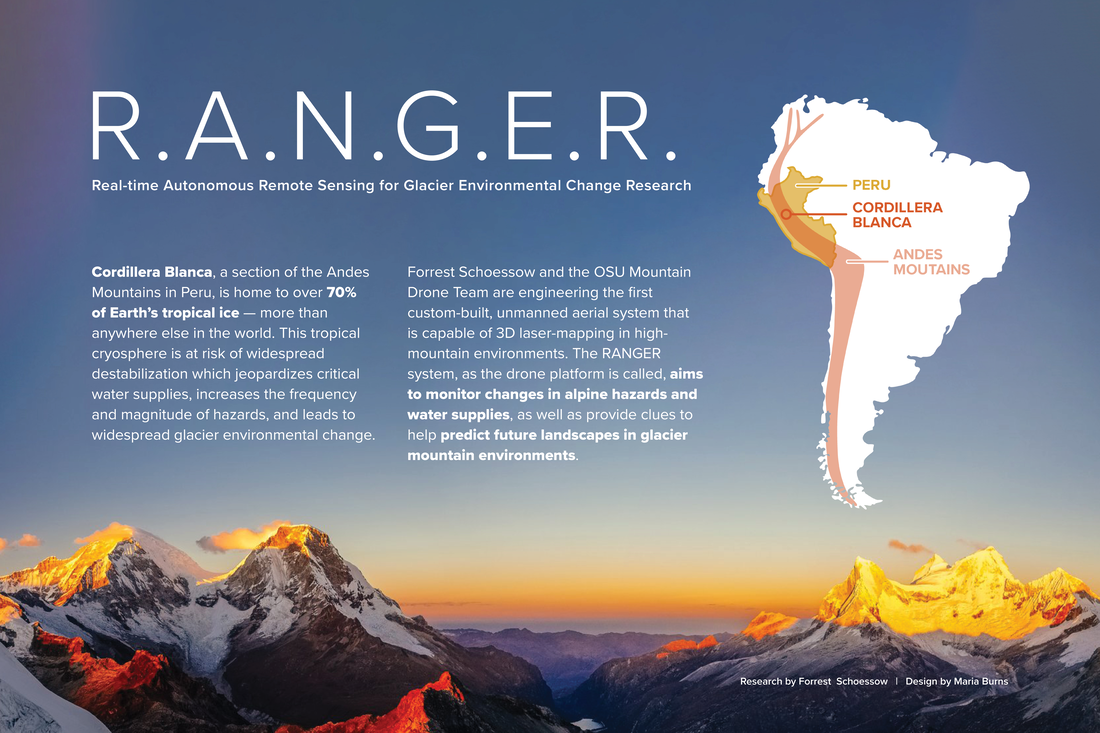
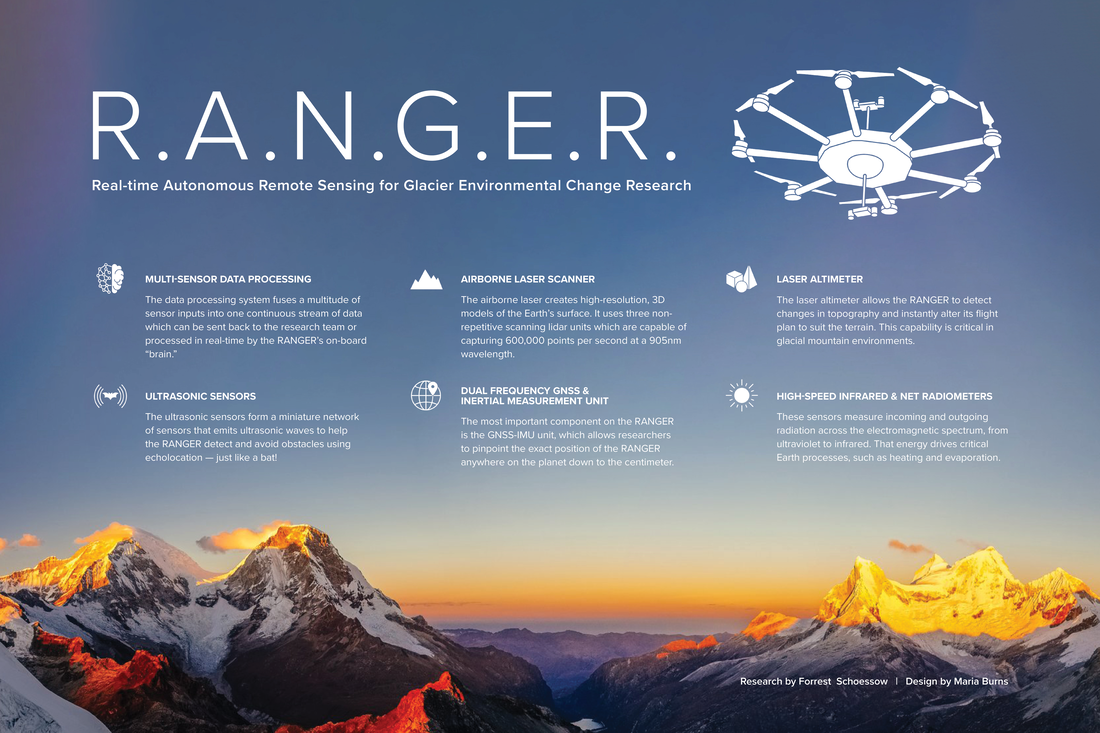
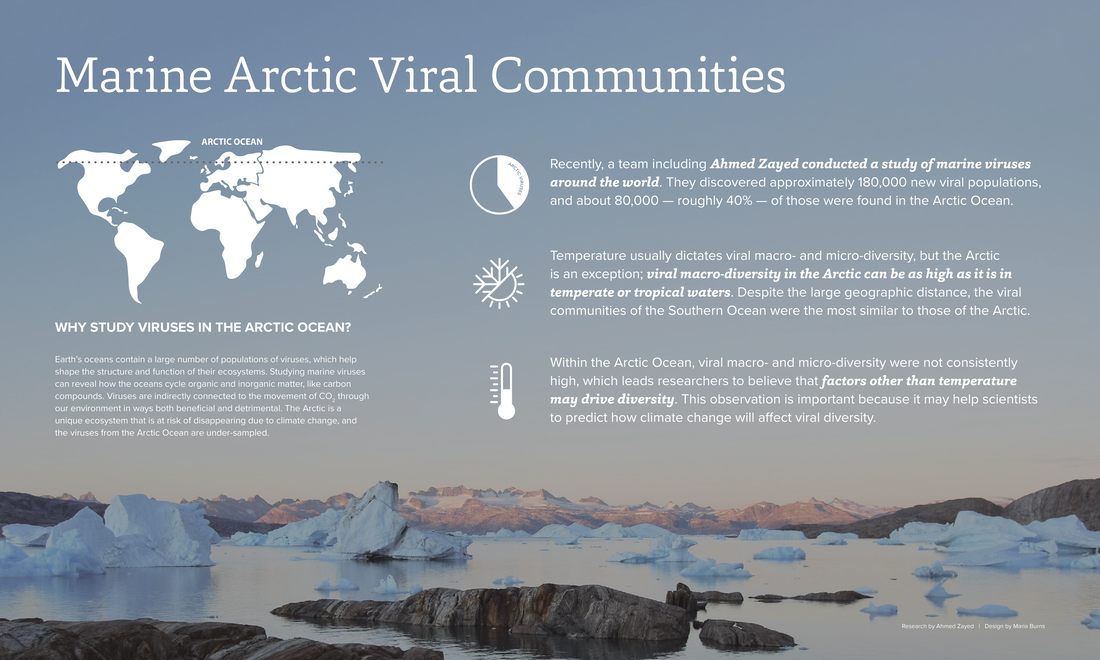
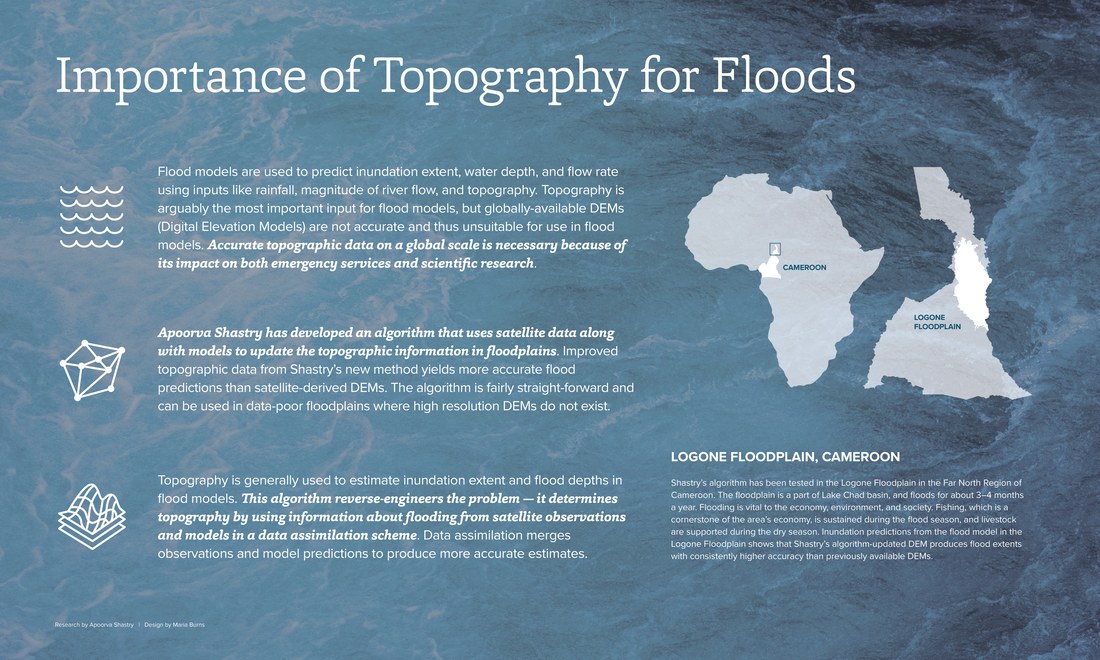
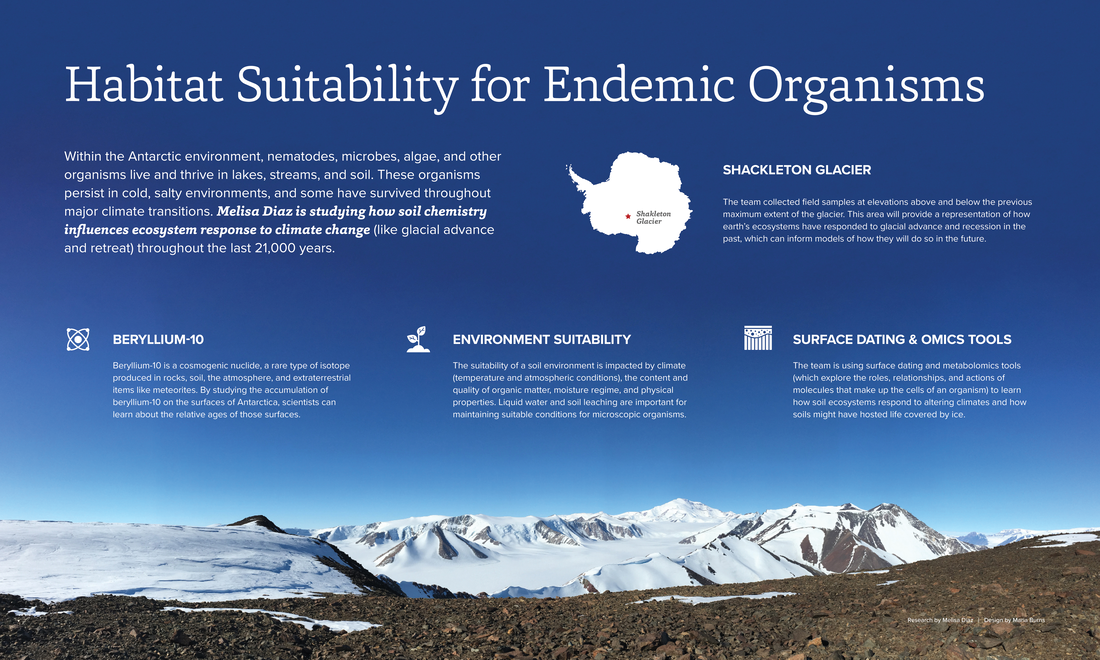
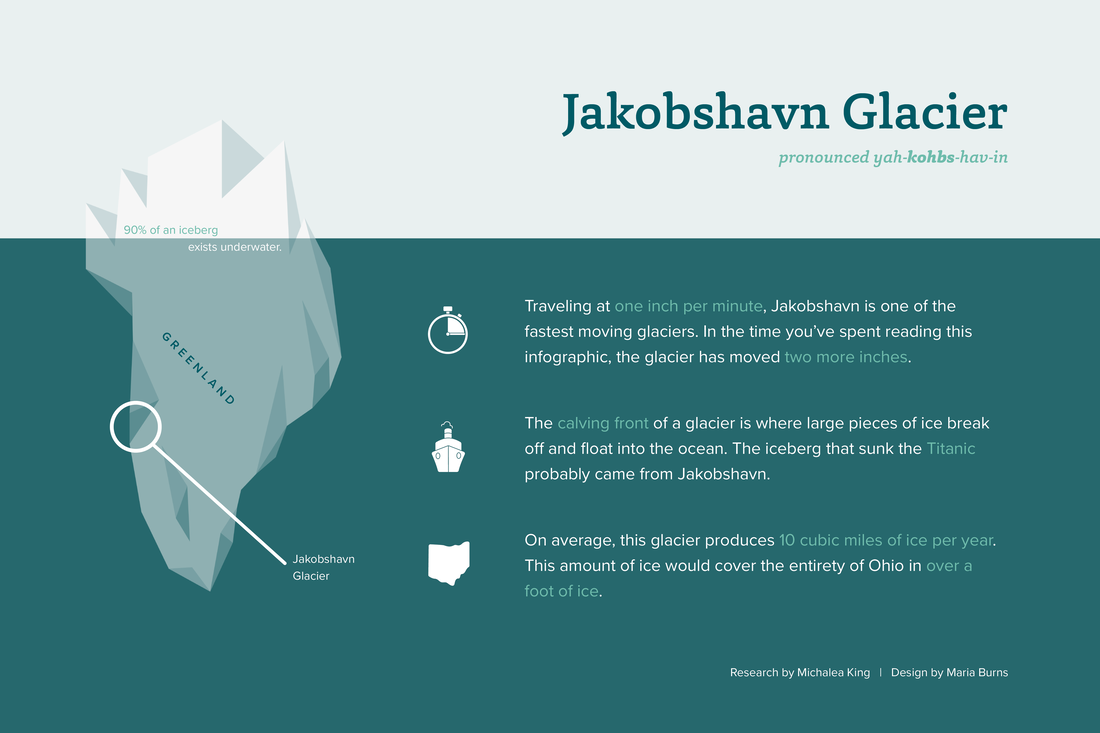
A large part of the work done at the Byrd Polar and Climate Research Center is research done by graduate students and full-time employees, and this research is presented to a broad audience. I worked closely with individual researchers to create infographics that summarize their research clearly and concisely.
I spoke in-depth with each researcher to understand the most important and most interesting points of their work in order to write the copy of the infographics. In addition to crafting the content and narrative of each infographic, I used photography, icons, maps, and typography to create a hierarchy of information. Viewers of these infographics, whether scientists in the field or lay people, can come away with a better understanding of each area of research.
I spoke in-depth with each researcher to understand the most important and most interesting points of their work in order to write the copy of the infographics. In addition to crafting the content and narrative of each infographic, I used photography, icons, maps, and typography to create a hierarchy of information. Viewers of these infographics, whether scientists in the field or lay people, can come away with a better understanding of each area of research.
|
|
|

|